


Please enter the answer below before you can view the full text.
8+7=
With the rapid increase of Unmanned Aircraft Vehicle (UAV) numbers, the contradiction between extensive flight demands and limited low-altitude airspace resources has become increasingly prominent. To ensure the safety and efficiency of low-altitude UAV operations, the low-altitude UAV public air route creatively proposed by the Chinese Academy of Sciences (CAS) and supported by the Civil Aviation Administration of China (CAAC) has been gradually recognized. However, present planning research on UAV low-altitude air route is not enough to explore how to use the ground transportation infrastructure, how to closely combine the surface pattern characteristics, and how to form the mechanism of “network”. Based on the solution proposed in the early stage and related researches, this paper further deepens the exploration of the low-altitude public air route network and the implementation of key technologies and steps with an actual case study in Tianjin, China. Firstly, a path-planning environment consisting of favorable spaces, obstacle spaces, and mobile communication spaces for UAV flights was pre-constructed. Subsequently, air routes were planned by using the conflict detection and path re-planning algorithm. Our study also assessed the network by computing the population exposure risk index (PERI) and found that the index value was greatly reduced after the construction of the network, indicating that the network can effectively reduce the operational risk. In this study, a low-altitude UAV air route network in an actual region was constructed using multidisciplinary approaches such as remote sensing, geographic information, aviation, and transportation; it indirectly verified the rationality of the outcomes. This can provide practical solutions to low-altitude traffic problems in urban areas.
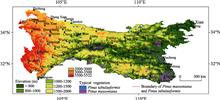
The Qinling Mountains is not only the geographical boundary between North and South China, but also the boundary between subtropical and warm temperate zones. It plays an important role in the geo-ecological pattern of China. However, there is controversy about the specific location of this geographical boundary in academic community due to the complexity, transition and heterogeneity of the transitional zone, as well as the differences in the delimitation indicators and research purposes. To further reveal the characteristics of the North-South transitional zone and clarify the specific location of the geo-ecological boundary between North and South China, combined with SRTM topographic data, temperature and precipitation data, Pinus massoniana forest and Pinus tabulaeformis forest, which represent subtropical coniferous forest in South China and temperate coniferous forest in North China respectively, were chosen to analyze their spatial distributions in the Qinling-Daba Mountains and the climatic conditions at their boundary with the climatic indexes of annual precipitation, the coldest month (January) average temperature, the warmest month (July) average temperature and the annual average temperature. The results show that: (1) Pinus massoniana and Pinus tabulaeformis forests and the climate indicators of their boundary can be used as one of the vegetation-climate indexes for the delimitation of subtropical and warm temperate zones. The boundary between the subtropical coniferous forest (Pinus massoniana forest) and temperate coniferous forest (Pinus tabulaeformis forest) is located along the south slope of Funiu Mountain to the north edge of Hanzhong Basin (the south slope of Qinling Mountains) at an altitude of 1000-1200 m, where the climatic indictors are stable: the annual precipitation is about 750-1000 mm, the annual average temperature is about 12-14℃, the coldest monthly average temperature is 0-4℃, and the warmest monthly average temperature is about 22-26℃. (2) It can be more scientifically to delimitate the boundary of subtropical and warm temperate zones in China by comprehensively considering the vegetation-climate indicators. Additionally, the boundary between subtropical and warm temperate zones in Qinling-Daba Mountains should be a transitional zone consisting of the boundaries of coniferous forests, broad-leaved forests and shrubs between subtropical and warm temperate zones. The results provide a scientific basis for the selection of delimitation index of subtropical and warm temperate zones.
Regional land use change is the main cause of the ecosystem carbon storage changes by affecting emission and sink process. However, there has been little research on the influence of land use changes for ecosystem carbon storage at both temporal and spatial scales. For this study, the Qihe catchment in the southern part of the Taihang Mountains was taken as an example; its land use change from 2005 to 2015 was analyzed, the Markov-CLUE-S composite model was used to predict land use patterns in 2025 under natural growth, cultivated land protection and ecological conservation scenario, and the land use data were used to evaluate ecosystem carbon storage under different scenarios for the recent 10-year interval and the future based on the carbon storage module of the InVEST model. The results show the following: (1) the ecosystem carbon storage and average carbon density of Qihe catchment were 3.16×10⁷ t and 141.9 t/ha, respectively, and decreased by 0.07×10⁷ t and 2.89 t/ha in the decade evaluated. (2) During 2005-2015, carbon density mainly decreased in low altitude areas. For high altitude area, regions with increased carbon density comprised a similar percentage to regions with decreased carbon density. The significant increase of the construction areas in the middle and lower reaches of Qihe and the degradation of upper reach woodland were core reasons for carbon density decrease. (3) For 2015-2025, under natural growth scenario, carbon storage and carbon density also significantly decrease, mainly due to the decrease of carbon sequestration capacity in low altitude areas; under cultivated land protection scenario, the decrease of carbon storage and carbon density will slow down, mainly due to the increase of carbon sequestration capacity in low altitude areas; under ecological conservation scenario, carbon storage and carbon density significantly increase and reach 3.19×10⁷ t and 143.26 t/ha, respectively, mainly in regions above 1100 m in altitude. Ecological conservation scenario can enhance carbon sequestration capacity but cannot effectively control the reduction of cultivated land areas. Thus, land use planning of research areas should consider both ecological conservation and cultivated land protection scenarios to increase carbon sink and ensure the cultivated land quality and food safety.
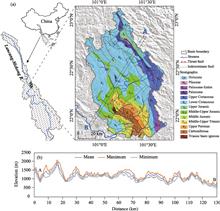
River incision and drainage reorganization have an important impact on the site selection of many major projects including city, road and others, and are the key issues of Quaternary environmental changes. Studies of river incision and river-network adjustment have traditionally been based on extensive field evidence, such as sediment age and beheaded river system. The Buyuan River basin is a large sub-basin of the upper Lancang-Mekong, with high mountains and extremely active erosion. The latter affects the preservation of the Quaternary period sediments leading to difficulties in understanding the main evolution characteristics of the basin. This study investigates differences in the equilibrium state of the longitudinal profile, infers incision rates, and evaluates drainage divide migration timelines using the stream-power incision model, the latest morphological dating, and Chi-plots (χ-z) based on digital elevation models (DEMs) on the GIS software platform. The final results show that two significant erosion base-level decreases occurred in the Late Pleistocene at least. The incision rate of the mainstream might have been 0-2.99 mm/yr since 100 ka BP and 0-3.28 mm/yr since 46 ka BP. The Chi-values across the divides suggest that space limited (or constrained) river reorganization and that there is no severe reorganization in the basin; the imbalance of traceable erosion only exists in local areas. The main driving force for the geomorphologic evolution of the Buyuan River basin is likely climate fluctuations rather than strong tectonic uplift since the Late Pleistocene.
Heavy metals, one of the most toxic classes of pollutants, are resistant to degradation and harmful to the biological environment. The lakes that have developed on the Tibetan Plateau are ideal regions to investigate historic heavy metal pollution, particularly through the use of the reliable210Pb dating technique. Environmental magnetism has been successfully applied to estimate heavy metal pollution in different environmental systems due to its characteristics of simple processing steps, good sensitivity, and non-destructibility. However, it has not yet been applied to assess heavy metal pollution in lake sediments on the Tibetan Plateau. A series of environmental magnetic investigations of Qiangyong Co Lake sediments (southern Tibetan Plateau) was therefore conducted to explore the relationship between magnetic minerals and mercury (Hg) concentrations. The results showed that the magnetic mineral species in lake sediments remained stable, with similar levels of four different components from 1899 to 2011. However, the proportion of component 1 (C1, hematite) increased continuously with the corresponding decrease in the proportion of C2 (goethite), while the proportions of C3 and C4 (magnetite) did not change significantly. As a result, the bulk magnetic signals (e.g., SIRM and χlf) were unsuitable for the evaluation of the Hg concentration; however, the proportion of hematite had a strong positive correlation with the Hg concentration. It is possible that the Qiangyong Glacier (the main water supply for Qiangyong Co Lake) has experienced faster melting with global and local warming, and the Hg trapped in cryoconite and ice was released. Hematite, with a large specific surface area, has a strong capacity for absorbing Hg, and both materials are ultimately transported to Qiangyong Co Lake. The proportion of hematite in a sample is therefore a suitable semi-quantitative proxy that can be used to evaluate the Hg concentration in Qiangyong Co Lake sediments. This study confirmed that the variation of magnetic minerals can provide a new method to estimate the variation of Hg concentrations and to study the process of Hg deposition in lakes in the southern Tibetan Plateau on the basis of a detailed environmental magnetic analysis.
The Ganjia Basin in Xiahe County, Gansu Province, China, is located on the northeastern edge of the Tibetan Plateau. The area lies in the transitional zone between the Plateau ethnic groups dominated by ancestral Tibetans, and the Central Plains dynasties dominated by ancestral Han in history. The Ganjia Basin is therefore well suited to studying the history of the intermixing of the Han and Tibetan peoples. In this study, we collected samples of organic materials from two ancient cities, Bajiaocheng (BJC) and Sirougucheng (SRGC), in the Ganjia Basin, which were used for radiocarbon dating. Our aims were to determine the construction times and function of the cities, based on the radiocarbon ages, Bayesian age modeling, and the analysis of relevant historical records. The results are used to discuss the role of the Ganjia Basin in the conflicts between and the integration of the two ethnic groups during the historical period. We conclude that BJC was established during 663-732 CE (Common Era); its early occupation history can be divided into an initial establishment phase (670-780 CE) and a phase of regeneration (880-1030 CE). SRGC was probably built at the time of the transition between the Song and Yuan dynasties (~1271 CE). Combining the dating results with an analysis of the architectural styles and historical records, we conclude that BJC was originally built by the Tubo Kingdom as a military stronghold, and its major functions were military, economic and religious, and to support the major eastward expansion of the Tubo. SRGC was most likely a temple-focused city intended to promote Tibetan Buddhism which was a major political and religious leadership for the Tibetans at that time, reflecting changes in the status of different religions in the Ganjia Basin. In addition, the intermixing and blending of the Han and Tibetan groups, reflected by the human activities in the Ganjia Basin, was an important demographic and cultural foundation for the formation of the culturally-diverse but spiritually-united modern Chinese people.
Based on archaeological surveys of Neolithic cultural development and GIS spatial analysis, this study reproduced the main characteristics of temporal distribution and settlement selection of the sites from the Neolithic Age in Anhui and identified a relationship between environmental evolution and human activity. The results show that altitude, slope direction, and slope gradient were consistent among the settlements at different stages of the Neolithic Age in Anhui, and the sites were mostly distributed in hilly and plain areas on southeast- or south-facing slopes of low gradients close to rivers. We determined that early Neolithic Age (9.0-7.0 ka BP) sites were scattered in small numbers and likely had little cultural exchange with communities of other provinces. The environmental characteristics of various regions in Anhui indicated that the climate was warm and humid with extensive water distribution. The sites of the mid Neolithic Age (7.0-5.0 ka BP) increased rapidly with wide distribution. They were mainly distributed in the plain area north of the Huaihe River and the southwestern areas of Anhui. In the mid Neolithic Age, the warm and humid climate gradually dried, and our ancestors slowly developed cultural exchanges. The largest number of sites existed during the late Neolithic Age (5.0-4.0 ka BP), and were distributed throughout the province. During this period, the overall climate was relatively dry, but humans could still obtain water and other resources through migration. The relatively benign climate facilitated cultural interaction and exchange, which increased during this time, and the Wanjiang culture matured. We also determined that as early civilization evolved, cultures in different regions responded differently to environmental changes. In humid subtropical regions, especially in low-lying plains and areas beside lakes, rivers, and coastal areas, the relatively dry climate in the late period of the middle Holocene, prefaced by a period of high humidity, was conducive to the development of human culture. The evidence from the Neolithic settlements in Anhui therefore reflects this subtropical man-land relationship between cultural development and environmental conditions.
The Lanshanmiao (LSM) Palaeolithic site, which was excavated in the summer of 2017 by the Zhejiang Provincial Institute of Cultural Relics and Archaeology, is the only excavated palaeolithic site in central Zhejiang Province to date. Luminescence dating methods, including optical stimulated luminescence (OSL) and thermal transfer OSL (TT-OSL) for quartz and post-infrared (IR) stimulated luminescence (pIRIR290) for feldspar, were used to determine the age of the LSM site. The results showed that the LSM section developed before 145.5 ± 12.5 ka and ended after 17.1 ± 1.0 ka. The TT-OSL dating of samples NJU2576 and NJU2615 showed that palaeolithic artifact-bearing layer was between 150 and 100 ka in age. The age range of the palaeolithic layer mainly corresponded to the transition between Marine Isotope Stage (MIS) 6 and MIS5. Our study showed that hominins prominently occupied the LSM site during the glacial and interglacial stages, when it exhibited a floodplain environment.
Farmland reforestation can contribute substantially to ecological restoration. Previous studies have extensively examined the ecological effects of farmland reforestation, but few of them have investigated the spatiotemporal responses of broad-scale landscape connectivity to reforestation. By using a typical agro-pastoral ecotone in northern China as a case study, we addressed this issue based on an innovative integration of circuit theory approach and counterfactual analysis. The forest connectivity through multiple dispersal pathways was measured using the circuit theory approach, and its spatiotemporal changes after reforestation were evaluated by counterfactual analysis. The results showed that from 2000-2015, the reforested farmland occupied 2095 km2, and 12.5% was on steeply sloped land. Farmland reforestation caused a greater increase in ecological connectivity by adding new ecological corridors and stepping stones in scattered forest areas rather than in areas with dense forest distributions. The newly added corridors and stepping stones were fragmented, short and narrow and thus deserve powerful protection. Future reforestation to improve landscape connectivity should highlight pinch point protection and obstacle removal as well as the tradeoff between farmland loss and farmer survival. Our findings are expected to inform the optimization of the Grain for Green policy from the perspective of broad-scale biodiversity conservation.
Maintenance of steady streamflow is a critical attribute of the continental river systems for safeguarding downstream ecosystems and agricultural production. Global climate change imposes a potential risk to water supply from the headwater by changing the magnitude and frequency of precipitation and evapotranspiration in the region. To determine if and to what extent the recent climate changes affected streamflow in major river systems, we examined the pattern of temporal variations in precipitation, temperature, evapotranspiration and changes in runoff discharge during 1958-2017 in the headwater region of the Yellow River in northeastern Tibetan Plateau. We identified 1989 as the turning point for a statistically significant 14% reduction in streamflow discharge (P < 0.05) for the period 1989-2017 compared with 1958-1988, approximately coinciding with changes in the monthly distribution but not the interannual variations of precipitation, and detected a mismatch between precipitation and runoff after 2000. Both annual precipitation and runoff discharge displayed four- and eight-year cyclic patterns of changes for the period 1958-1988, and a six-year cyclic pattern of changes for the period 1989-2017, with two intensified two-year cyclic patterns in the changes of precipitation and a three-year cyclic pattern in the change of runoff further detected for the later period. Our results indicate that the temporal changes in runoff are not strictly consistent with the temporal variations of precipitation in the headwater region of Yellow River during the period 1958-2017. In particular, a full recovery in annual precipitation was not reflected in a full recovery in runoff toward the end of the study period. While a review of literature yielded no apparent evidence of raised evapotranspiration in the region due to recent warming, we draw attention to increased local retention of rainwater as a possible explanation of differential changes in precipitation and runoff.
In this paper, meteorological industry standard, daily mean temperature, and an improved multiple regression model are used to calculate China’s climatic seasons, not only to help understand their spatio-temporal distribution, but also to provide a reference for China’s climatic regionalization and crop production. It is found that the improved multiple regression model can accurately show the spatial distribution of climatic seasons. The main results are as follows. There are four climatic seasonal regions in China, namely, the perennial-winter, no-winter, no-summer and discernible regions, and their ranges basically remained stable from 1951 to 2017. The cumulative anomaly curve of the four climatic seasonal regions clarifies that the trend of China’s climatic seasonal regions turned in 1994, after which the area of the perennial-winter and no-summer regions narrowed and the no-winter and discernible regions expanded. The number of sites with significantly reduced winter duration is the largest, followed by the number of sites with increased summer duration, and the number of sites with large changes in spring and autumn is the least. Spring advances and autumn is postponed due to the shortened winter and lengthened summer durations. Sites with significant change in seasonal duration are mainly distributed in Northwest China, the Sichuan Basin, the Huanghe-Huaihe-Haihe (Huang-Huai-Hai) Plain, the Northeast China Plain, and the Southeast Coast.
The border areas of the Tibetan Plateau and the neighboring mountainous areas have a high incidence of earthquakes with a magnitude greater than Ms 5.0, as well as having a dense distribution of geological disasters such as collapses, landslides, and debris flows. Revealing the post-disaster economic development and recovery process is very important for enhancing disaster prevention and response capacity in order to formulate control policies and recovery methods for post-disaster economic reconstruction based on economic resilience. Using long-term socioeconomic data and the autoregressive integrated moving average (ARIMA) model, this paper calculated the economic resilience index of the areas most severely affected by the Wenchuan Earthquake of 2008 and adopted the improved variable returns to scale (VRS) date envelopment analysis (DEA) model and the Malmquist productivity index to analyze the efficiency and effect of annual post-disaster recovery. The results show that: (1) the economic resilience index of the areas most severely affected by the Wenchuan Earthquake was 0.877. The earthquake resulted in a short-term economic recession in the affected areas, but the economy returned to pre-quake levels within two years. In addition, the industrial economy was less resilient than agriculture and the service industry. (2) The comprehensive economic recovery efficiency of the disaster-stricken area in the year following the disaster was 0.603. The comprehensive efficiency, the pure technical efficiency, and the scale efficiency of the plain and hilly areas were significantly greater than those of the plateau and mountain areas. (3) The annual fluctuation in total factor productivity (TFP) following the disaster was considerable, and the economic recovery efficiency decreased significantly, resulting in a short-term economic recession. The TFP index returned to steady state following decreases of 33.7% and 15.2%, respectively, in the two years following the disaster. (4) The significant decrease in the post-disaster recovery efficiency was caused mainly by technological changes, and the renewal of the production system was the leading factor in determining the economic resilience following the disaster. With the decline in the scale of economic recovery following the earthquake, long-term economic recovery in the disaster-stricken areas depended mainly on pure technical efficiency, and the improvement in the latter was the driving force for maintaining the long-term growth of the post-disaster economy. Therefore, according to the local characteristics of natural environment and economic system, the disaster-stricken areas need to actively change and readjust their economic structures. At the same time, attention should be paid to updating the production system to enhance the level of technological progress and give full play to the scale effects of large-scale capital, new facilities, human resources, and other investment factors following the disaster so as to enhance the impact of economic resilience and recovery efficiency in response to the disaster.
There is a lack of basic theory and method to examine the effect of administrative division (AD) adjustment on the regional development. Based on the theory and practice of Chinese AD adjustments, the paper defined the concept of administrative region potential (ARP) and developed the quantitative model to measure the ARP. Then, the model was validated taking Chongqing as an empirical case. The results show that: (1) the ARP consists of energy of position (i.e., geographic space factors) and gravitational potential energy (i.e., administrative levels and management system factors). Administrative division adjustment can change the ARP, thereby changing its path and driving force of regional development. (2) The ARP model of Chongqing city can reflect the effects of administrative division adjustment events on the Chongqing city objectively. Specifically, ARP includes variables of land jurisdiction, human capital level, fixed assets investment capacity, administrative hierarchy of fiscal decentralization and administrative decentralization. (3) The ARP promotion has significant positive influence on the performance of local economic development in Chongqing city. (4) Reasonable AD adjustments will help the region integrate production elements and resources, enhance the political power of the city, improve its ARP, and then promote local economic development. The ARP model is proved to be an efficient way to understand and explain the regional effect of AD adjustment. It provides a new analytical perspective for the planning of AD adjustment in various regions, and can also be used as a practical method for assessing the effects of AD adjustment.
The pattern for utilization of rural space is closely related to rural transformation development (RTD). The problem of rural space utilization is an important manifestation of the uncoordinated relationship between land use patterns and rural development status during a transformation period. Considering the rural space utilization issue, this article seeks to analyze the interaction mechanisms between land use transition (LUT) and rural spatial governance and then build a rural spatial governance analysis framework based on LUT. Also, the paper explores the internal relationship between rural spatial governance and rural vitalization and discusses the research prospective of the interaction. The study found that: (1) Rural space utilization has systemic problems such as limited development space, ill-defined ownership and poor organization, which have become important obstacles for rural development. (2) The uncoordinated relationship between LUT and RTD is an important reason for the dilemma surrounding rural space utilization. (3) The LUT provides a basis for determining the timing of rural spatial governance, specifying spatial governance objectives, and clarifying rural spatial governance methods. (4) The construction of a comprehensive analysis framework of “matter-ownership-organization” of rural space based on the LUT has created conditions for the orderly promotion of rural spatial governance. (5) Rural spatial governance which facilitates the integration of urban-rural development is an important foundation for rural vitalization. (6) Interaction analysis of LUT, RTD and rural spatial governance is conducive to facilitating research on the operational mechanism of rural regional systems and to expanding the research field of rural geography.
To evaluate the climatic and ecological impacts of anthropogenic activities in global change research, it is essential to reconstruct historical land use and land cover change on regional and global scales. In this study, we reconstructed cropland areas for 54 provinces within the European part of Tsarist Russia (ETR) over the periods of 1696-1914 using historical data, including cropland area, population, grain consumption, and grain yield per unit area. The main results are as follows. (1) Total cropland areas and fractional cropland areas of ETR for 8 time sections during 1696-1914 were reconstructed, the former increased from 31.98×10⁴ km2 to 147.40×10⁴ km2, and the latter increased from 7.89% to 29.20%. The per capita cropland area decreased from 0.0246 km2 to 0.0113 km2 during 1696-1914. (2) Cropland expanded from the central and southwestern ETR to the black soil region, surrounding area of the Volga River, Ukraine region, the new Russia region, the vicinity of Ural, and north Caucasus region. (3) The expansion of territory, increase and migration of population, policies related to agricultural development and foreign trade, and the impacts of climate change were the reasons for the changes in cropland within ETR from 1696 to 1914. (4) In 1914, the cropland area and fractional cropland area of each province varied from 0.16×10⁴ km2 and 0.76% to 5.65×10⁴ km2 and 76.68%, respectively. (5) The comparisons show that the cropland areas of ETR in this study for 1696-1914 are higher than those in the HYDE 3.2 dataset. The main reason for this finding might be the underestimation of per capita cropland areas in the HYDE 3.2 dataset, which values remained at approximately 0.01 km2 from 1700 to 1920.
The railway is an indispensable feature of a nation’s infrastructure, and the gauge is an internal and objective technical regulation of the railway. In the large-scale regional space, the track gauges reflect the development differences, historical relations and mutual influences between countries and regions. This makes the railway, originally as a regional connection, have special social, political, military and other multiple attributes. Based on this, the paper, from the perspective of railway gauge, takes the Eurasian continent as the case region to explore the spatial pattern, formation mechanism and organizational mode of communication of the Eurasian continental railway geo-system. The results show that 11 kinds of railway gauge structures exist in Eurasia, which respectively belong to three types of wide-gauge, standard-gauge, and narrow-gauge, but the mainstream gauge only includes 1520 mm, 1435 mm and 1067 mm. Considerable variation in the coverage length and space range of different gauges is apparent, which provides a physical and technological basis for railway system differentiation and network fragmentation, which leads to the formation of eight railway geo-systems. Due to different modes for railway transport management in different geographical locations, the geographical pattern and geographical relationship of four transport organizations are formed. What especially important is the emergence of “1435 gauge space” and “1520 gauge space”, as well as the railway geo-space confrontation between them, on the Eurasian continent. Besides, we also find that the railway geo-system of Eurasia is mainly affected by the technology dissemination, path dependence, geopolitics, national defense and the colonial expansion of military latitude, and on this basis, five geo-modes of railway gauge propagation are formed.
With rapid globalization, industrial parks are playing an increasingly important role in the national and regional development. Since the Belt and Road Initiative (BRI) was put forward, national-level overseas industrial parks of China have emerged with new development features and trends. It is of great importance to carry out a comparative study on domestic and overseas industrial parks of China. Based on the perspective of spatiotemporal evolution, this paper compares and analyzes national-level overseas industrial parks along the Belt and Road (B&R) and domestic industrial parks of China. In time, China’s industrial parks have experienced four stages with distinctive state-led characteristic. There are different development paths and modes for overseas industrial parks along the B&R and domestic industrial parks. In space, the national-level overseas industrial parks are invested and constructed by Chinese enterprises (mostly from the coastal developed cities), and mainly distributed in the countries along the B&R. Through typical cases comparison of Thai-Chinese Rayong Industrial Zone and Tianjin Economic-Technological Development Area, the paper finds that national-level overseas industrial parks are basically market-driven and concentrated in traditional advantageous industries, while domestic industrial parks are mainly government-led high-tech industries. Localization of overseas industrial parks and remote coupling with domestic industrial parks become very important.
Frequent chilling injury has serious impacts on national food security and in northeastern China heavily affects grain yields. Timely and accurate measures are desirable for assessing associated large-scale impacts and are prerequisites to disaster reduction. Therefore, we propose a novel means to efficiently assess the impacts of chilling injury on soybean. Specific chilling injury events were diagnosed in 1989, 1995, 2003, 2009, and 2018 in Oroqen community. In total, 512 combinations scenarios were established using the localized CROPGRO-Soybean model. Furthermore, we determined the maximum wide dynamic vegetation index (WDRVI) and corresponding date of critical windows of the early and late growing seasons using the GEE (Google Earth Engine) platform, then constructed 1600 cold vulnerability models on CDD (Cold Degree Days), the simulated LAI (Leaf Area Index) and yields from the CROPGRO-Soybean model. Finally, we calculated pixel yields losses according to the corresponding vulnerability models. The findings show that simulated historical yield losses in 1989, 1995, 2003 and 2009 were measured at 9.6%, 29.8%, 50.5%, and 15.7%, respectively, closely (all errors are within one standard deviation) reflecting actual losses (6.4%, 39.2%, 47.7%, and 13.2%, respectively). The above proposed method was applied to evaluate the yield loss for 2018 at the pixel scale. Specifically, a sentinel-2A image was used for 10-m high precision yield mapping, and the estimated losses were found to characterize the actual yield losses from 2018 cold events. The results highlight that the proposed method can efficiently and accurately assess the effects of chilling injury on soybean crops.
Glaciers provide essential resources and services for human well-being and socio-economic development in arid regions. It is of great significance for regional socio- economic sustainable development and environmental protection to conduct a glacier service value assessment and to analyze its spatiotemporal characteristics. Based on the first and second Chinese glacier inventories of the Qilian Mountains, a glacier service value evaluation system was established. Then the glacier service value and its spatiotemporal variation were assessed by combining the methods of unit area service price, value equivalent factor, and the glacier service value change index (GSCI). Three key results were obtained. (1) The total service value of glaciers in the Qilian Mountains for 2016 was 24.354 billion yuan. The main services provided were climate regulation and runoff regulation, which accounted for 60.58% and 33.14% of the total service value, respectively. Minor services were freshwater supply and hydropower, which accounted for 3.47% and 1.75% of the total value, respectively. The value of other types of services was about 0.259 billion yuan. (2) Among the various river systems in the Qilian Mountains, the Shule River basin had the highest glacier service value (7.771 billion yuan, 31.91%), followed by the Haltang River basin (4.321 billion yuan, 17.74%) and the Beida River basin (3.281 billion yuan, 13.47%). In terms of administrative divisions, the glacier service value of the Qilian Mountains in Qinghai Province was 1.138 billion yuan higher than that of Gansu Province at 11.608 billion yuan, of which the services in the Haixi Mongol and Tibetan Autonomous Prefecture and Jiuquan City were valued at 11.124 (45.68%) and 7.758 (31.86%) billion yuan, respectively. (3) During the period from 1956 to 2010, the service value of glaciers in the Qilian Mountains declined by 435 million yuan, with an acceleration in the decreasing trend from west to east.
Based on simulations by the Beijing Climate Center climate system model version 2 (BCC-CSM2), the possible changes in net primary productivity (NPP) of the terrestrial ecosystem in China during the 21st century are explored under the Shared Socioeconomic Pathway 2 (SSP2) 4.5 scenario. We found both the near-term and long-term terrestrial NPP basically shows a unanimously increasing trend, which indicates low ecosystem productivity risk in the future. However, the simple linear regression is insufficient to characterize the long-term variation of NPP. Using the piecewise linear regression approach, we identify a decreasing trend of NPP in large areas for the latter part of the 21st century. In the northeast region (NER) from east Inner Mongolia to west Heilongjiang province, NPP decreases significantly after 2059 at a rate of -0.9% dec-1. In the south region (SR) from Zhejiang to Guangxi provinces, a rapid decline of -2.4% dec-1 is detected after 2085. Further analysis reveals that the rapid decline in SR is primarily attributed to the decrease in precipitation, with temperature playing a secondary role, while the NPP decline in NER seems to have no evident relations with climate change. These findings are useful for making preparations for potential ecosystem crisis in China in the future.
Currently beach morphodynamic classification is the most important foundation to conduct associated coastal geomorphological studies. This paper carried out beach morphodynamic classifications for 12 straight beaches on headland-bay coasts based on field survey and evaluated the applicability of the most widely used dimensional fall velocity parameter (Ω) and relative tidal range parameter (RTR). One reflective, five intermediate and six non-barred dissipative beaches were visually classified and sand size seemed to be a key factor to differentiate these beaches. The studied beaches were in relatively low wave energy environments (Hs 3 KWm -1 and MSR < 2 m. It was found that the model of the traditional winter-and-summer profiles was not applicable in the study area in despite of distinct wave seasonality. The studied beaches were more possible to hover around a limited range due to relatively low background wave environments and variability without considering typhoon impacts, which needs further research on actual breaker wave conditions and beach morphodynamic type responses to typhoon events.
The reform of global production mode and social system accelerate the process of urbanization, and the urban-rural factors accelerate rural space diversification. Based on the space production theory and game theory, this paper analyzed the space diversification process and its influence on Beicun village. The results show that: (1) In the past 30 years, the development of Beicun has experienced three stages: agricultural development, industrial development, and service industrial development. The industrial structure has changed from single to diverse. The transformation of agricultural decentralization to rural community has been realized. (2) Accompanying the rural economic development transformation, the land use type and structure of Beicun has diversified. The spatial relationship of various types of land use was complicated and gave rise to new characteristics of mixed land for commercial and residential use, and industrial and commercial use, gradually forming a circular spatial layout structure model of public service facilities, traditional residential areas and modern residential areas, commercial areas, agricultural and industrial areas. (3) Rural space diversification was mainly due to the intervention of new industries and the transformation of leading industries. The endogenous land transferring mechanism and exogenous urban capital jointly promoted the industrialization process, and the market power promoted the transformation of industry into the service industry. (4) The industrialization process promoted the functional replacement of historical buildings by village organizations. It changed the social relations of the village with the blood clan and geography oriented, and produced the occupational relation between migrant workers and urban low-income groups. (5) The multi-differentiation of suburban rural space followed the game logic of capital and land interests. The rural community played a key mediation in the competition for space and the game of interests among local villagers, farmers, economic cooperation, industrial operators, and service owners.
Mapping the human footprint (HF) makes it possible to quantify human influence, which has had an unprecedented impact on the global ecosystem. Using five categories of human pressure data, this study mapped the HF of the Hengduan Mountain region and assessed the effectiveness of nature reserves in reducing human impacts. The results showed that the HF of the Hengduan Mountain region was generally higher in the south and lower in the north. The HF increased by 11.24% over the past 25 years, with faster growth in the southeast. The HF growth rate in nature reserves was much lower than that across the region, which indicated that nature reserves played an important role in reducing the impact of human pressure. A study of Baimaxueshan nature reserve found that establishing nature reserves could effectively reduce the impact of human activities, and no “leakage” occurred. Population growth was an important reason for the increased HF in nature reserves. The development of ecotourism in nature reserves must be based on ecological protection. Strengthening the long-term monitoring, evaluation, and management of nature reserves is a basic requirement for their long-term development.
The environmental ecology of the Yangtze River Economic Zone (YREZ) faces ecological function decline, deterioration and degradation under intense human activities, long-term development and utilization and its economy has developed rapidly over recent decades. Eco-efficiency is considered as a measure of coordinated development of economy, resources, environment and ecology, and is currently considered a very important issue. In this paper, based on the slack-based measure and data envelope analysis model, we take 129 prefecture-level cities of the YREZ as the study unit and measure the eco-efficiency of the YREZ in 2000, 2005, 2010 and 2015, which considers undesired output. The evaluation of the status quo of the regional eco-efficiency development was carried out at provincial, prefectural and city scales. The spatial autocorrelation test model and standard deviation ellipse were used to analyze the spatially distributed characteristics and the evolutionary regularity of eco-efficiency. Our study suggested that the eco-efficiency value varied significantly at different spatiotemporal scales and the overall distribution presented an “N-shaped” pattern, the value is the largest downstream and the smallest upstream. Regional eco-efficiency presented certain volatility in growth and a clear spatial positive agglomeration trend from 2000 to 2015. The spatial distribution of each agglomeration area was also significantly different, forming some high-high agglomeration areas at the center of the shaft with Shanghai and surrounding cities, and some low-low agglomeration areas at the center with middle reaches and upstream cities. The low-high over-aggregation and high-low polarization clusters were fewer. At the same time, with the change of the research period, the degree of positive agglomeration became increasingly pronounced and the eco-efficiency gap of the neighborhood unit reduced. The regional eco-efficiency value of the YREZ presented a spatial distribution pattern in the northeast-southwest axis and the evolutionary pattern of the regional eco-efficiency similarly showed a northeast-southwest orientation.
Ecosystem service values (ESVs) of bays and their response to sea reclamation are of great practical importance for forming bay eco-compensation policy and extension of blue economic space. Based on land use information of bays collected during the period of 1990-2015, the spatiotemporal evolution of ESVs of 12 main bays in East China Sea and their response to sea reclamation activities over the past 25 years were quantitatively analyzed. The analysis results indicate that ESVs of bays in East China Sea showed a continuous downward trend and the whole ecosystem was continuously degraded, in which the degradation degree of ESV in the southern bays was higher than that in the northern bays. Spatial zoning of ESVs of bays in East China Sea was remarkable, showing a continuous downward trend from low-value to high-value zone. Spatial variation of ESVs of each bay was also significant, expanding from a city and from inland to the coast, which suggests that human activities, mainly reclamation, have become main agents for ESV evolution of bays in East China Sea. ESVs of bays have a significant response to sea reclamation, manifested as a significant negative correlation between ESV and reclamation intensity. The correlation in the southern bays was stronger than that in the northern bays, which was caused by different effects of sea reclamation modes on ESV evolution of muddy and bedrock bays. A negative effect of sea reclamation activities on bay ecosystem was hysteretic. Therefore, an attention should be paid to dynamic monitoring and early warning of development status in offshore areas, ecosystem-level reclamation control policy, and coastal wetland reserves planning. Moreover, the spatial coupling mechanism study between bay ecosystem service demand and its service supply capacity should be strengthened to realize systematic regulation of bay ecological security pattern.
Global historical land use scenarios are widely used to simulate the climatic and ecological effects of changes in land cover; however, reliability evaluation of these scenarios for data on China’s forests is missing. By using a historical document-derived Chinese forest dataset (CHFD) for the years 1700-2000, we evaluated the reliability of data on forests in China over three global scenarios—SAGE (Center for Sustainability and the Global Environment), PJ (Pongratz Julia), and KK10 (Kaplan and Krumhardt 2010)—through trend-related, quantitative, and spatial comparisons. The results show the following: (1) Although the area occupied by forests in China in the SAGE, PJ, KK10, and CHFD datasets decreased over the past 300 years, there were large differences between global scenarios and CHFD. The area occupied by forests in China in the SAGE scenario for 1700-1990 was 20%-40% more than that according to CHFD, and that occupied by forests in the KK10 from 1700 to 1850 was 32%-46% greater than that in CHFD. The difference between the PJ and CHFD was lower than 20% for most years. (2) Large differences were detected at the provincial and grid cell scales, where the PJ scenario was closer to CHFD in terms of total forested area. Provinces with large differences in terms of trend and quantity were 84% and 92% of all provinces, respectively. Grid cells with relative differences greater than 70% accounted for 60%-80% of all grids. (3) These global historical land use scenarios do not accurately reveal the spatiotemporal pattern of Chinese forests due to differences in the data sources, methods of reconstruction, and spatial scales.
As a special outcome of urbanization, mega-towns not only play an important role in the process of socio-economic development, but also are important contributors to urbanization. Based on a spatial database of mega-towns in China, this paper explores the spatial distribution features and growth mechanisms of China’s 238 mega-towns using the nearest neighbour distance method, kernel density estimation, regression analysis, global autocorrelation, local autocorrelation and other spatial analysis methods. Results of spatial distribution features show that: (1) on the national scale, the existing 238 mega-towns mainly gathered in the southeast coastal areas of China; they formed two spatial core agglomerations, several secondary ones and a southeast coastal agglomeration belt; (2) on the regional scale, each economic region’s index was less than 1, indicating that mega-towns in each region tended to be spatially agglomerated due to the close relationship with regional development level and their number; (3) on the provincial scale, 68% of provincial-level units in China tended to be a spatial agglomeration of mega-towns; only one province had a random distribution; the number of mega-towns in those evenly-distributed provinces was generally small. The growth of mega-towns was determined by a combination of various natural and humanistic factors, including topography, location, economy, population, traffic, and national policy. This paper chose digital elevation model (DEM), location advantage, economic density, population density, and highway density distribution as corresponding indicators as quantitative factors. By combining their local autocorrelation analysis, these factors all showed certain influence on the spatial growth of mega-towns and together scheduled it. In the future, provinces and cities should make full use of the mega-town functions to promote their socioeconomic development, especially the central and western regions in China.
A near-distance, nonlinear coupling relationship objectively exists between urbanization and the eco-environment. The issue of how to coordinate the relationship between them has become a global strategic and scientific issue. This study reveals the nature, relationship and intensity of coupling between urbanization and the eco-environment from a theoretical perspective. Based on the strength of coupling, relationships can be characterized as having very-low, low, medium, high, very-high or full coupling intensity, which correspond to the categories of random coupling, indirect coupling, loose coupling, cooperative coupling, close coupling, and controlled coupling. Together, these make up an urbanization and eco-environment “coupling tower.” This study also develops an urbanization and eco-environment coupling circle theory and generates 45 coupling graphs (including linear, exponential-curve, logarithmic-curve, double exponential-curve and S-curve graphs) per 10° of rotation of the coupling circle, with different graphs corresponding to different urban development stages and development models. Of the various coupling graphs, the S-curve graph is considered the optimum, as it reflects the best interactivity scenario between urbanization and the eco-environment. Using an S-curve coupling graph, and with the help of an SD model and based on the complex one-to-one, one-to-many, and many-to-many relationships between the variables, this study develops the Urbanization and Eco-environment Coupler (UEC). The UEC is composed of 11 regulating elements and 201 variables. If one variable changes, it changes the whole, affecting the structure, function and regulation of the entire coupler. The UEC includes three spatio-temporal scales: static regulation between multiple urbanization areas and eco-environment areas at the same time, dynamic regulation between the same urbanization area and eco-environment area at different times, and dynamic regulation between multiple urbanization areas and eco-environment areas at different times. Regulation gradually promotes evolution from low-level coupling to high-level coupling between urbanization and the eco-environment.
Extreme weather is an important noise factor in affecting dynamic access to river morphology information. The response characteristics of river channel on climate disturbances draw us to develop a method to investigate the dynamic evolution of bankfull channel geometries (including the hydraulic geometry variables and bankfull discharges) with stochastic differential equations in this study. Three different forms of random inputs, including single Gaussian white noise and compound Gaussian/Fractional white noise plus Poisson noise, are explored respectively on the basis of the classical deterministic models. The model parameters are consistently estimated by applying a composite nonparametric maximum likelihood estimation (MLE) method. Results of the model application in the Lower Yellow River reveal the potential responses of bankfull channel geometries to climate disturbances in a probabilistic way, and, the calculated average trends mainly run to synchronize with the measured values. Comparisons among the three models confirm the advantage of Fractional jump-diffusion model, and through further discussion, stream power based on such a model is concluded as a better systematic measure of river dynamics. The proposed method helps to offer an effective tool for analyzing fluvial relationships and improves the ability of crisis management of river system under varying environment conditions.
Saltwater intrusion in the estuary area threatens the use of freshwater resources. If river discharge increases to a critical value, then saltwater intrusion frequency and salinity level decreases. In this study, long-term river discharge and tidal range data in the Yangtze River Estuary (YRE) and salinity data obtained in the upper South Branch of the YRE were used to analyze the characteristics of different variables and the basic law of their interactions. Two methods, namely, the material analysis method and empirical models, were applied to determine the critical river discharge for saltwater intrusion control. Results are as follows: (1) the salinity might exceed the drinking water standard of China when the river discharge was less than 30,000 m3/s. Approximately 69% of salinity excessive days occurred when the river discharge was less than 15,000 m3/s; (2) the tidal range in the YRE roughly varied in sinusoidal pattern with a 15-day cycle length. Exponential relationship existed between daily salinity (chlorinity) and daily mean tidal range. Combining these two features with the cumulative frequency statistics of tidal ranges, it was showed that notable saltwater intrusion occurred when the tidal range was more than 2.7 m at Qinglonggang station. Moreover, the critical discharge was found to be slightly higher than 11,000 m3/s; (3) various of empirical models for salinity prediction could be chosen to calculate the critical discharge. The values obtained by different models were in the range of 11,000-12,000 m3/s; (4) the proposed critical discharge to reduce notable saltwater intrusion was 11,500 m3/s. After the Three Gorges Reservoir operation, the minimum river discharge into the YRE in 2008-2017 was below the critical discharge, thereby suggesting an increase in the minimum river discharge by reservoir regulation in drought periods.
Finding accurate methods for estimating and mapping land prices at the macro-scale based on publicly accessible and low-cost spatial data is an essential step in producing a meaningful reference for regional planners. This asset would assist them in making economically justified decisions in favor of key investors for development projects and post-disaster recovery efforts. Since 2005, the Ministry of Land, Infrastructure, and Transport of Japan has made land price data open to the public in the form of observations at dispersed locations. Although this data is useful, it does not provide complete information at every site for all market participants. Therefore, estimating and mapping land prices based on sound statistical theories is required. This paper presents a comparative study of spatial prediction of land prices in 2015 in Fukushima prefecture based on geostatistical methods and machine learning algorithms. Land use, elevation, and socioeconomic factors, including population density and distance to railway stations, were used for modeling. Results show the superiority of the random forest algorithm. Overall, land prices are distributed unevenly across the prefecture with the most expensive land located in the western region characterized by flat topography and the availability of well-connected and highly dense economic hotspots.
Border area is not only an important gateway for inland opening-up, but also an important part of completing the building of a moderately prosperous society and optimizing national urban spatial pattern in China. Due to the location, natural resources endowment, and traffic accessibility, the urbanization speed is relatively slow in border areas. Therefore, it is a special area that needs to pay close attention to, especially under the background of the Belt and Road Initiative and China’s regional coordinated development program. Based on the county-level data from 2000 to 2015, this paper tries to analyze the spatio-temporal pattern of urbanization in 134 border counties, and applies geographical detector method to study the driving forces of urbanization in border areas. Conclusions are as follows: (1) From 2000 to 2015, urbanization rate in border areas has been lower than the national average, and the gap has been widening. Some border counties in southern Xinjiang, Tibet, northeast of Inner Mongolia, and Yunnan, are even facing the problem of population loss. (2) In the same period, urbanization rate in the northwestern and southwestern border is low, while their urbanization rate grows relatively faster comparing with other border counties; urbanization rate in Tibet border is the lowest and grows relatively slowly; urbanization rate in the northeastern and northern border is slightly higher, but it grows slowly or even stagnates. (3) Transportation and industry are the important driving forces of urbanization in border areas, while the driving forces of market is relatively weak. And there are obvious mutual reinforcements among the driving forces, while the effort and explanatory power of resource force increases obviously after interaction. (4) Urbanization rate in the northwestern and southwestern border areas grows relatively fast, with industrial force and transportation force, market force and administrative force as the main driving forces respectively. Tibet border area has the lowest urbanization rate and growth rate, as the driving force of urbanization with strong contribution has not yet formed in Tibet. In the northeastern and northern border areas, the contribution of transportation force to urbanization is greater than other forces, and its interaction with market and industry has obvious effects.
Climate change resulting from CO2 emissions has become an important global environmental issue in recent years. Improving carbon emission performance is one way to reduce carbon emissions. Although carbon emission performance has been discussed at the national and industrial levels, city-level studies are lacking due to the limited availability of statistics on energy consumption. In this study, based on city-level remote sensing data on carbon emissions in China from 1992-2013, we used the slacks-based measure of super-efficiency to evaluate urban carbon emission performance. The traditional Markov probability transfer matrix and spatial Markov probability transfer matrix were constructed to explore the spatiotemporal evolution of urban carbon emission performance in China for the first time and predict long-term trends in carbon emission performance. The results show that urban carbon emission performance in China steadily increased during the study period with some fluctuations. However, the overall level of carbon emission performance remains low, indicating great potential for improvements in energy conservation and emission reduction. The spatial pattern of urban carbon emission performance in China can be described as “high in the south and low in the north,” and significant differences in carbon emission performance were found between cities. The spatial Markov probabilistic transfer matrix results indicate that the transfer of carbon emission performance in Chinese cities is stable, resulting in a “club convergence” phenomenon. Furthermore, neighborhood backgrounds play an important role in the transfer between carbon emission performance types. Based on the prediction of long-term trends in carbon emission performance, carbon emission performance is expected to improve gradually over time. Therefore, China should continue to strengthen research and development aimed at improving urban carbon emission performance and achieving the national energy conservation and emission reduction goals. Meanwhile, neighboring cities with different neighborhood backgrounds should pursue cooperative economic strategies that balance economic growth, energy conservation, and emission reductions to realize low-carbon construction and sustainable development.
The Chinese government ratified the Paris Climate Agreement in 2016. Accordingly, China aims to reduce carbon dioxide emissions per unit of gross domestic product (carbon intensity) to 60%-65% of 2005 levels by 2030. However, since numerous factors influence carbon intensity in China, it is critical to assess their relative importance to determine the most important factors. As traditional methods are inadequate for identifying key factors from a range of factors acting in concert, machine learning was applied in this study. Specifically, random forest algorithm, which is based on decision tree theory, was employed because it is insensitive to multicollinearity, is robust to missing and unbalanced data, and provides reasonable predictive results. We identified the key factors affecting carbon intensity in China using random forest algorithm and analyzed the evolution in the key factors from 1980 to 2017. The dominant factors affecting carbon intensity in China from 1980 to 1991 included the scale and proportion of energy-intensive industry, the proportion of fossil fuel-based energy, and technological progress. The Chinese economy developed rapidly between 1992 and 2007; during this time, the effects of the proportion of service industry, price of fossil fuel, and traditional residential consumption on carbon intensity increased. Subsequently, the Chinese economy entered a period of structural adjustment after the 2008 global financial crisis; during this period, reductions in emissions and the availability of new energy types began to have effects on carbon intensity, and the importance of residential consumption increased. The results suggest that optimizing the energy and industrial structures, promoting technological advancement, increasing green consumption, and reducing emissions are keys to decreasing carbon intensity within China in the future. These approaches will help achieve the goal of reducing carbon intensity to 60%-65% of the 2005 level by 2030.
To resolve conflicts between development and the preservation of the natural environment, enable economic transformation, and achieve the global sustainable development goals (SDGs), green development (GD) is gradually becoming a major strategy in the construction of an ecological civilization and the ideal of building a “beautiful China”, alongside the transformation and reconstruction of the global economy. Based on a combination of the concept and implications of GD, we first used the Slacks Based Model with undesirable outputs (SBM-Undesirable), the Theil index, and the spatial Markov chain to measure the spatial patterns, regional differences, and spatio-temporal evolution of urban green development efficiency (UGDE) in China from 2005 to 2015. Second, by coupling natural and human factors, the mechanism influencing UGDE was quantitatively investigated under the framework of the human-environment interaction. The results showed that: (1) from 2005 to 2015, the UGDE increased from 0.475 to 0.523, i.e., an overall increase of 10%. In terms of temporal variation, there was a staged increase, with its evolution having the characteristics of a “W-shaped” pattern. (2) The regional differences in UGDE followed a pattern of eastern > central > western. For different types of urban agglomeration, the UGDE had inverted pyramid cluster growth characteristics that followed a pattern of “national level > regional level > local level”, forming a stable hierarchical scale structure of “super cities > mega cities > big cities > medium cities > small cities”. (3) UGDE in China has developed with significant spatial agglomeration characteristics. High-efficiency type cities have positive spillover effects, while low-efficiency cities have negative effects. Different types of urban evolution processes have a path dependence, and a spatial club convergence phenomenon exists, in which areas with high UGDE are concentrated and drive low UGDE elsewhere. (4) Under the framework of regional human-environment interaction, the degree of human and social influence on UGDE is greater than that of the natural background. The economic strength, industrial structure, openness, and climate conditions of China have positively promoted UGDE.
The concept of ‘Beautiful China’ is a new goal of ecological construction in the new era of socialism and aims to meet the needs of people as they strive for a better life. National land spatial planning is one major component of the Chinese state’s overall planning for various spatial types. The concept of ‘Beautiful China’ is thus a leading goal of Chinese development in the second centenary. The background of this concept aims for ‘ecological beauty’ as well as the combined beauty of ‘economy-politics-culture-society-ecology.’ The construction of ‘Beautiful China’ therefore necessitates a differentiated evaluation index system that is built on the basis of local conditions. This concept is intimately related to land spatial planning and the idea of Beautiful China guides an important direction for this planning which itself provides an important mechanism and spatial guarantee for construction. The establishment of land spatial planning nevertheless needs to strengthen further discussion of the regional system of human-land relationship, point axis system, main functional division, sustainable development, resources and environmental carrying capacity as well as new urbanization, and the rural multi-system. The aim of this paper is to summarize current thinking in land spatial planning, scientifically analyze the natural geographical conditions, the socioeconomic development, the interrelationship of the land space, plan the goal, vision and path of land space, encourage the public to participate in and carry out dynamic evaluation, build an intelligent system platform for land and spatial planning to realize the goal of ‘Beautiful China’ from a geographical perspective. And they can also present key ideas relating to the compilation and implementation of land spatial planning.
The Beautiful China Initiative (BCI) is a plan for the sustainable development of the Chinese nation as well as for China to fulfill the United Nations’ 2030 Agenda for Sustainable Development. The Chinese government’s “five-in-one” approach provides strategic arrangements for developing the BCI, and President Xi Jinping proposed a timetable and “road map” for the BCI at the National Conference on Ecological and Environmental Protection. Nevertheless, the theoretical basis, evaluation index system, evaluation criteria and effectiveness of the BCI are currently unclear. This paper begins by exploring the basic content of the BCI from narrow and broad perspectives. It regards the theory of human-nature harmonious coexistence and the five-in-one beauty theory as the core theoretical bases of the BCI and constructs a five-element BCI evaluation index system (ecological environment, green development, social harmony, system perfection and cultural heritage) and utilizes the assessment method of the United Nations’ Human Development Index to assess scientifically the effectiveness of the BCI in 341 prefecture-level cities. The results show the average BCI index (the Chinese Academy of Sciences Beauty Index) score to be 0.28, which is quite low, while the average scores for the individual element indexes of the ecological environment index, green development index, social harmony index, system perfection index and cultural heritage index are 0.6, 0.22, 0.29, 0.22 and 0.07, respectively. All of these are relatively low values, with relatively large discrepancies in regional development, indicating that progress in the BCI is generally slow and unbalanced. To realize the BCI’s timetable and roadmap to a high quality and high standard, it is suggested that a common system for evaluating the progress of the BCI is developed and promulgated so that dynamic monitoring and phased evaluations can take place; BCI technical assessment standards are compiled and published; BCI comprehensive zoning is undertaken; pilot projects adapted to local conditions are launched in BCI sample areas; and BCI results are incorporated into performance indicators at all levels of government.
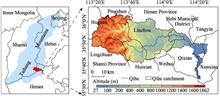
Since 2007, the Chinese government has initiated the building of national eco-cultural protection areas (NECPAs), thereby embarking on a signi?cant transformation of the model of intangible cultural heritage (ICH) protection in China. To understand the origin and outputs of this policy, this paper demonstrates the context of China’s NECPAs. It proposes a conceptual NECPA framework that mainly features regional overall ICH protection. This is followed by an examination of the case of Xiangxi in Western Hunan as a pilot zone for China’s eco-cultural protection. Xiangxi has performed much related work to promote NECPAs and made great progress in regional overall ICH protection. This insight suggests that there are bene?ts and costs associated with promotion of China’s NECPAs and regional overall ICH protection. Despite the advantages of institutional innovation, the unexpected side effects actually undermine the success of plan implementation.
Flood is one of the severest natural disasters in the world and has caused enormous causalities and property losses. Previous studies usually focus on flood magnitude and occurrence time at event scale, which are insufficient to contain entire behavior characteristics of flood events. In our study, nine behavior metrics in five categories (e.g., magnitude, duration, timing, rates of changes and variability) are adopted to fully describe a flood event. Regional and interannual variations of representative flood classes are investigated based on behavior similarity classification of numerous events. Contributions of geography, land use, hydrometeorology and human regulation on these variations are explored by rank analysis method. Results show that: five representative classes are identified, namely, conventional events (Class 1, 61.7% of the total), low discharge events with multiple peaks (Class 2, 5.3%), low discharge events with low rates of changes (Class 3, 18.1%), low discharge events with high rates of changes (Class 4, 10.8%) and high discharge events with long durations (Class 5, 4.1%). Classes 1 and 3 are the major flood events and distributed across the whole region. Class 4 is mainly distributed in river sources, while Classes 2 and 5 are in the middle and down streams. Moreover, the flood class is most diverse in normal precipitation years (2006, 2008-2010 and 2015), followed by wet years (2007, 2013-2014), and dry years (2011 and 2012). All the impact factor categories explain 34.0%-84.1% of individual flood class variations. The hydrometeorological category (7.2%-56.9%) is the most important, followed by geographical (1.0%-6.3%), regulation (1.7%-5.1%) and land use (0.9%-2.2%) categories. This study could provide new insights into flood event variations in a comprehensive manner, and provide decision-making basis for flood control and resource utilization at basin scale.
To understand the non-equilibrium morphological adjustment of a river in response to environmental changes, it is essential to (i) accurately identify how past conditions of water and sediment have impacted current morphological adjustment of the river, and (ii) establish a corresponding simulation for non-equilibrium conditions. Based on discharge and suspended sediment concentration (SSC) as well as 82 cross-sectional data items for the Huayuankou-Lijin reach of the Lower Yellow River in the period 1965-2015, the process of adjustment of the geometry of the main channel (area, width, depth, and geomorphic coefficient), and its responses to changes in discharge and SSC for different reaches are statistically analyzed. Following this, a delayed response model (DRM) of the geometry of the main channel subjected to variations in discharge and SSC is established using a multi-step analytical model, with the discharge and SSC as the main controlling factors. The results show that the area, width, and depth of the main channel decreased initially, then increased, decreased again, and finally increased again. These features of the geometry of the channel were positively correlated with the 4-year moving average discharge and negatively with the 4-year moving average SSC. The geomorphic coefficient for the Huayuankou-Sunkou reach exhibited a trend of decrease, whereas that of the Sunkou-Lijin reach decreased initially, then increased, decreased again, and finally increased again. Except for the Huayuankou-Gaocun reach in 1965-1999, the coefficient was negatively correlated with the 4-year moving average discharge and positively with SSC. The simulated values of the morphological parameters of the main channel for all sub-reaches obtained using the DRM agreed well with the measured values. This indicates that the DRM can be used to simulate the process of response of the cross-sectional geometry of the main channel to variations in the water and sediment. The results of the model show that the adjustment of the geometry of the main channel was affected by the discharge and the SSC at present (30%) as well as for the previous 7 years (70%). The proposed model offers insights into the mechanism whereby past water and sediment influence the current morphological adjustment of the river, and provides an effective method for predicting the magnitude and trend of the geometry of the main channel under different flow conditions.
Land use and land cover (LULC) alteration has changed original energy balance and heat fluxes between land and atmosphere, and thus affects the structure characteristics of temperature and humidity fields over urban heterogeneous surfaces in different spatio-temporal scales. Lanzhou is the most typical river valley city of China, it is chosen as the case study. Typical river valley terrain, rapid urbanization and severe air pollution have caused unique urban climate and urban heat island (UHI) effects in Lanzhou. Firstly, the spatial structure characteristics and dynamic evolution of temperature and humidity fields in autumn are simulated by mobile measurement experiment and GIS spatial analysis method. The results show that temperature and humidity fields have significant dynamic change within a day, and have multiple center and multiple intensity level characteristics. Then, LULC and normalized difference vegetation index (NDVI) are extracted from remote sensing images, the distribution patterns of temperature and humidity fields have close relationships with LULC and NDVI. Moreover, there is a significant positive correlation between impervious surface area and thermal field intensity. A positive correlation between NDVI value and humidity field intensity has been found as well as a negative correlation between NDVI value and thermal field intensity. Finally, heat fluxes and energy balance characteristics between ground and atmosphere are analyzed based on the Bowen-ratio System experiments. This study could provide theoretical support and practical guidance for urban planning, urban eco-environment construction and air pollution prevention of river valley city.
Widespread aeolian deposits on the Tibetan Plateau (TP) have provided valuable palaeoclimatic information. However, the primary factors (e.g., climate factors, human activity, and vegetation cover) controlling aeolian deposition remain elusive. In this paper, we use a dataset that comprises new and published ages of Holocene aeolian sand and loess in the middle reaches of the Yarlung Zangbo River to identify the primary controlling factors and palaeoclimatic implications of aeolian deposition. Several intervals of enhanced aeolian accumulation centered at 8.5-7.8, 6.4-5.8, 4.5-4.0, 3.1-1.8, and 0.9 ka are identified, generally consistent with regional low rainfall events and weak Indian summer monsoon (ISM). This suggests that regional wetness, dominated by the ISM, may play a key role in modulating dust emissions and aeolian deposition on centennial timescales. Our results show that on centennial- to millennial-scales, ISM activity can be reconstructed by non-continuous aeolian deposits in the monsoon dominated TP.
Population migration, especially population inflow from epidemic areas, is a key source of the risk related to the coronavirus disease 2019 (COVID-19) epidemic. This paper selects Guangdong Province, China, for a case study. It utilizes big data on population migration and the geospatial analysis technique to develop a model to achieve spatiotemporal analysis of COVID-19 risk. The model takes into consideration the risk differential between the source cities of population migration as well as the heterogeneity in the socioeconomic characteristics of the destination cities of population migration. It further incorporates a time-lag process based on the time distribution of the onset of the imported cases. In theory, the model will be able to predict the evolutional trend and spatial distribution of the COVID-19 risk for a certain time period in the future and provide support for advanced planning and targeted prevention measures. The research findings indicate the following: (1) The COVID-19 epidemic in Guangdong Province reached a turning point on January 29, 2020, after which it showed a gradual decreasing trend. (2) Based on the time-lag analysis of the onset of the imported cases, it is common for a time interval to exist between case importation and illness onset, and the proportion of the cases with an interval of 1-14 days is relatively high. (3) There is evident spatial heterogeneity in the epidemic risk; the risk varies significantly between different areas based on their imported risk, susceptibility risk, and ability to prevent the spread. (4) The degree of connectedness and the scale of population migration between Guangdong’s prefecture-level cities and their counterparts in the source regions of the epidemic, as well as the transportation and location factors of the cities in Guangdong, have a significant impact on the risk classification of the cities in Guangdong. The first-tier cities - Shenzhen and Guangzhou - are high-risk regions. The cities in the Pearl River Delta that are adjacent to Shenzhen and Guangzhou, including Dongguan, Foshan, Huizhou, Zhuhai, Zhongshan, are medium-risk cities. The eastern, northern, and western parts of Guangdong, which are outside of the metropolitan areas of the Pearl River Delta, are considered to have low risks. Therefore, the government should develop prevention and control measures that are specific to different regions based on their risk classification to enable targeted prevention and ensure the smooth operation of society.
Investigating the spatio-temporal transmission features and process of novel coronavirus disease 2019 (COVID-19) mitigation strategies are of great practical significance to understand the development of COVID-19 and establish international cooperation for prevention and control. In this paper, the cumulative number of confirmed cases, number of confirmed cases per day and cumulative number of deaths, were used to compare transmission paths, outbreaks timelines, and coping strategies of COVID-19 in China and the US. The results revealed that: first, the COVID-19 outbreaks in both China and the US exhibited a 6-week initiation stage. In China, the COVID-19 erupted in late January. It lasted only a short period of time and was almost completely contained within 6-8 weeks. But the COVID-19 erupted in early March in the US and was still in the peak or post-peak stage. Second, in China, the COVID-19 emerged in Wuhan and spread to other regions of Hubei Province and then nationwide, exhibiting a cross(“+”)-shaped of spread with Wuhan city as the center. Importantly, the COVID-19 in China had a large concentration and there were no national outbreaks. In contrast, the COVID-19 in the US first spread through New York and the western and eastern coasts but has since emerged throughout the entire country. Third, the lack of emergency response planning in both countries in the early stage (about 6-week) hampered COVID-19 prevention. However, actively high-pressure prevention and control measures were used to basically control COVID-19 in early March in China. And then China has gradually resumed business and production activities. Unfortunately, the US government missed the best opportunity to contain the epidemic. Faced with the choice between economic recovery and coronavirus containment, the US removed the quarantine and restriction measures too early. The COVID-19 is continuing to spread in the country and blossom everywhere, still showing no signs of receding.
A largely unexplored application of “Big Data” in urban contexts is using human mobility data to study temporal heterogeneity in intercity travel networks. Hence, this paper explores China’s intercity travel patterns and their dynamics, with a comparison between weekdays and holidays, to contribute to our understanding of these phenomena. Using passenger travel data inferred from Tencent Location Big Data during weekdays (April 11-15, 2016) and National Golden Week (October 1-7, 2016), we compare the spatial patterns of Chinese intercity travel on weekdays and during Golden Week. The results show that the average daily intercity travel during Golden Week is significantly higher than that during weekdays, but the travel distance and degree of network clustering are significantly lower. This indicates temporal heterogeneity in mapping the intercity travel network. On weekdays, the three major cities of Beijing, Shanghai, and Guangzhou take prominent core positions, while cities that are tourism destinations or transportation hubs are more attractive during Golden Week. The reasons behind these findings can be explained by geographical proximity, administrative division (proximity of cultural and policy systems), travel distance, and travel purposes.
The urban-rural transformation from dichotomy to integration is a gradual process. Like rural areas in many countries, Chinese rural society is experiencing a decline in all spheres due to depopulation, aging, lack of economic opportunity, and so on. Aiming at solving the serious rural issues, China proposed the implementation of a rural revitalization strategy and the promotion of an integrated urban-rural development for the first time in 2017. This proposal marks the transformation of the urban-rural relationship, and the integrated urban-rural development reflects a significant conceptual change. Researches on issues of rural decline are urgently needed to determine the most effective method for rural revitalization and development from the perspective of the urban-rural dynamics. In this context, this paper focuses on studying the theory, technology and management of rural revitalization and development. We construct a theoretical framework for urban-rural integration based on population-land-industry-right between the urban and rural systems, regarding land engineering for land capacity building as the technical support and the rural land system reform and reconstruction as the policy support for management. This research will provide theoretical support for the implementation of China’s rural revitalization strategy.
The United States, Russia and China are militarily and economically among the most powerful countries in the post-Cold War period, and the interactions between the three powers heavily influence the international system. However, different conclusions about this question are generally made by researchers through qualitative analysis, and it is necessary to objectively and quantitatively investigate their interactions. Monthly-aggregated event data from the Global Data on Events, Location and Tone (GDELT) to measure cooperative and conflictual interactions between the three powers, and the complementary cumulative distribution function (CCDF) and the vector autoregression (VAR) method are utilized to investigate their interactions in two periods: January, 1991 to September, 2001, and October, 2001 to December, 2016. The results of frequencies and strengths analysis showed that: the frequencies and strengths of USA-China interactions slightly exceeded those of USA-Russia interactions and became the dominant interactions in the second period. Although that cooperation prevailed in the three dyads in two periods, the conflictual interactions between the USA and Russia tended to be more intense in the second period, mainly related to the strategic contradiction between the USA and Russia, especially in Georgia, Ukraine and Syria. The results of CCDF indicated that similar probabilities in the cooperative behaviors between the three dyads, but the differences in the probabilities of conflictual behaviors in the USA-Russia dyad showed complicated characteristic, and those between Russia and China indicated that Russia had been consistently giving China a hard time in both periods when dealing with conflict. The USA was always an essential factor in affecting the interactions between Russia and China in both periods, but China’s behavior only played a limited role in influencing the interactions between the USA-Russia dyad. Our study provides quantitative insight into the direct cooperative and conflictual interactions between the three dyads since the end of the Cold War and helps to understand their interactions better.
Especially since 2012 Chinese companies have acquired stakes as investors and constructors of overseas ports in both high-income and emerging economies. These initiatives play an important role in the construction of a Maritime Silk Road and China’s Belt and Road Initiative (BRI). Although a result of many factors, of which Chinese port investments are only one, macro-geographical gravity methods show that distance impedance and increases in the export market potential, export supply capacity and access to imports of these countries drove increases in income per capita. Export supply capacity rose particularly in Southeast Asia and more recently in Sub-Saharan Africa. In difficult times for the world economy, countries in which China invested in overseas port infrastructure saw increases in national export market potential and income per capita, due to reduction in the impedance of distance, while in the case of developing economies export market supply capacity and access to imported capital equipment and intermediate goods improved.
We collected and verified documentary records of the latest spring snowing dates (LSSD) in Hangzhou during Southern Song Dynasty. Furtherly, the statistical correlation between this proxy and February-April mean temperature in Hangzhou was examined, and samples later than the perennial mean of the LSSD during Southern Song Dynasty were transformed into the decadal mean of LSSD by means of Boltzmann function. General characteristics of this reconstructed LSSD series with a 10-year temporal resolution was analyzed, and it was also compared with other documentary evidences and reconstructed climate series in China for the period 1131-1270. The results and discussion suggested that: (1) Records of the LSSD in Hangzhou during Southern Song Dynasty did not refer to ice pellets and graupels, which had an explicit climate significance (-0.34oC/10d, R2=0.37, p<0.001). However, when this proxy is used to reconstruct temperature changes, all dates should be converted into proleptic Gregorian style and meet the same criterion of “true Qi” as the Chinese traditional calendar after 1929. (2) The decadal mean of LSSD can be effectively estimated by using the forefront of LSSD in the decade on the basis of Boltzmann function, whose extrapolation has a lesser uncertainty than those on the basis of linear models or polynomial models. (3) The spring climate in Hangzhou during 1131-1270 was almost as warm as the period 1951-1980. At the centennial scale, this period can be divided into two phases: the cold 1131-1170 and the warm 1171-1270. In the latter, 1181-1200 and 1221-1240 were two cold intervals at the multi-decadal scale. (4) The reconstructed LSSD series was consistent well with other documentary evidences and reconstructed climate series in China for 1131-1270, which may reflect the influence on the climate over most regions of China imposed by the Pacific Decadal Oscillation (PDO).
Mapping floods is important for policy makers to make timely decisions in regards to emergency responses and future planning. It is therefore crucial to develop a rapid inundation modelling framework to map flood inundation. This study develops an airborne scanning laser altimetry (LiDAR) digital elevation model (DEM) based Rapid flood Inundation Modelling framework (LiDAR-RIM) for assessment of inundation extent, depth, volume and duration for flood events. The modelling framework has been applied to the mid-Murrumbidgee region in the southeast Murray-Darling Basin, Australia for two flood events occurred in December 2010 and March 2012. The inundation extents estimated using this methodology compared well to those obtained from two Landsat ETM+ images, demonstrating suitability and applicability of this method. For testing possibility of larger area application, the framework also uses 30-m resolution shuttle radar topography mission (SRTM)-DEM to replace LiDAR-DEM for the same modelling. The inundation extents obtained by using the SRTM-DEM are smaller than those obtained using the LiDAR-DEM, especially for large flood events. A possible reason is that the river cross sections obtained from the SRTM-DEM are not accurate enough for inundation modelling. The LiDAR-RIM has an advantage for process modelling and scenario modelling under future climatic conditions.
The operation of large-scale reservoirs have modified water and sediment transport processes, resulting in adjustments to the river topography and water levels. The polynomial fitting method was applied to analyze the variation characteristics of water levels under different water discharge values in the Jingjiang reach of the Yangtze River from 1991-2016. The segregation variable method was used to estimate the contributions of the varied riverbed evaluation, the downstream-controlled water level, and the comprehensive roughness on the altered water level at an identical flow. We find that low water levels in the Jingjiang reach of the Yangtze River from 1991-2016 are characterized by a significant downward trend, which has intensified since 2009. Riverbed scouring has been the dominate factor causing the reduced low water level while increased roughness alleviated this reduction. From 1991-2016, there was first a decrease followed by an increase in the high water level. The variation characteristic in terms of the “high flood discharge at a high water level” before 2003 transformed into a “middle flood discharge at a high water level” since 2009. The increased comprehensive roughness was the main reason for the increased high water level, where river scouring alleviated this rise. For navigation conditions and flood control, intensified riverbed scouring of the sandy reaches downstream from dams enhanced the effects that the downstream water level has on the upstream water level. This has led to an insufficient water depth in the reaches below the dams, which should receive immediate attention. The altered variation characteristics of the high water level have also increased the flood pressure in the middle reaches of the Yangtze River.
The Yangtze River floodplain is critical for migratory waterbirds along the East Asian-Australasian Flyway (EAAF). Greater awareness of its global importance is urgently needed to ensure waterbird populations remain in favourable conservation status, as well as the enhancement of wider wetland biodiversity within this region. The designation of protected wetland areas and building a green ecological corridor in the Yangtze floodplain is now becoming a critical issue of interest to the Chinese government. Priority sites in this area were identified based on the criteria used to identify sites that qualify as Wetlands of International Importance (Ramsar Sites) and Important Bird and Biodiversity Areas (IBAs) by using multi-source data. The results show that 140 of the sites surveyed are priority sites. The Importance Index (I) for the whole floodplain decreased slightly from 2001-2005 and an unbalanced distribution pattern is evident with Jiangxi and Hunan provinces significantly higher than the other provinces in the floodplain. Although more than 60% of the priority sites are currently located outside protected areas, the average Conservation Effectiveness Index (C) of the whole floodplain is 75.6%, which suggests the coverage of protected areas for most wintering waterbird population is reasonable. Conservation of the Yangtze River floodplain needs to be further strengthened due to declining waterbird abundances and the mismatch between the distribution of protected areas and their importance for wintering waterbirds. A comprehensive system for priority site identification and protection and scientific review is needed. Multi-sourced data from regular, systematic and coordinated monitoring of waterbird distribution and abundance across the EAAF, as well as national scale citizen science programmes are also critically important.
Uneven urban and rural development is one of the main reasons for the decline of the countryside. This imbalance could be measured by the urban-rural difference index (URDI). Existing studies on urban-rural differences have focused on single dimension between urban and rural areas, and lack a systematic multi-dimensional measurement. Based on the construction of an index system and model for measuring urban-rural differences, this study took the Huang-Huai-Hai Plain (HHHP) as the study area, explores the spatial pattern of urban-rural differences in the area, and used geographical weighted regression models to identify the factors affecting urban-rural development differences. Results show that the mean value of URDI in the HHHP was 0.295, and the URDI in its western region was higher than that in the east. The average URDI was relatively high in the western counties along the Beijing-Guangzhou Railway. The low level of urban-rural “population-land-industry” development in the HHHP is an important reason for the small differences between urban and rural areas. Improvements in road transportation infrastructure have led to an increase in the urban-rural development gap. However, the driving force of the road network on urban development is greater than that on rural areas. The role of county economic agglomeration is gaining strength. In the process of rapid economic development, more attention should be paid to the development of the rural economy and the overall revitalization of the countryside. The equivalent allocation of social service facilities is an effective way to solve the problem of urban-rural imbalance. Further analysis demonstrated that terrain factors have relatively little influence on the URDI. This study provides a new perspective and measurement method for understanding the integration of urban and rural development, and provides a useful reference for guiding the urban-rural integration development and the rural revitalization.
Capacity for grain self-sufficiency on the Tibetan Plateau (TP) is an important basis for ensuring social stability and regional sustainability. Thus, based on county-level statistical data for population, grain production and consumption, we analyzed patterns and trends in grain supply and demand at regional, provincial, and county levels on the TP between 1985 and 2016. We applied two indices to evaluate capacity for grain self-sufficiency and found that the regional average self-sufficiency rate increased quickly by 1.97%/a since 1989, reaching 173.03% on the plateau over the period between 2010 and 2016. This indicates that grain supply in this region is able to fully meet demand. In addition, all provinces apart from Xinjiang exhibited similar increasing trends, attaining grain self-sufficiency during 2010-2016. Furthermore, 59% of counties attained grain self-sufficiency over this period, mainly distributed in southern Tibet, in the Sichuan-Tibet junction area, and in eastern Qinghai Province. A number of gaps in grain supply and demand occurred within the headwater regions of the Yangtze and Yellow rivers as well as on the Qiangtang Plateau. Grain self-sufficiency significantly increased over the study period in 36% of counties, mainly distributed in the agricultural areas of southeastern Tibet and in eastern Qinghai. Across the whole plateau, capacity for grain self-sufficiency substantially increased between 1985 and 2016, although serious spatial imbalances remain.
Systematically revealing the impact of cultivated land fragmentation (CLF) on the geographical agglomeration pattern of agricultural specialization (AS) has positive significance for national agricultural production management. Based on the data of the second national land survey and agricultural production, this study has explored the impact of CLF on spatial heterogeneity of agricultural agglomeration in China by comprehensively using the Theil index, ordinary least square model and geographically weighted regression. Results showed that: (1) the regional differentiation of the CLF in China is obvious, and the cultivated land fragmentation index is generally characterized by increasing pattern from northwest to southeast. (2) Spatially, the development level of AS in China has formed three high-value clusters in the Northeast China Plain, the Qinghai-Tibet Plateau, and the middle of the Middle-lower Yangtze Plain; and the low-value contiguous areas centered on the Yunnan-Guizhou Plateau and the Sichuan Basin and surrounding regions, with significant spatial differences. The contribution of grain crops, economic crops, and vegetables and melon to the level of AS was 74.63%, 9.09%, and 16.28%, respectively, and the pattern of agricultural geographical aggregation dominated by grain crops has primarily taken in shape. (3) CLF is significantly negatively correlated with AS, and every 1% increase in the degree of CLF will result in a decrease of about 0.2% in AS. However, the impact of CLF on the geographic agglomeration of different crop categories or groups varies significantly. Among them, CLF has a prominent impact on the specialization level of grain crops and vegetables and melon. Each 1% increase in the CLF will reduce the specialization level of grain crops by 0.38%, and increase the level of vegetables and melon by about 0.22%. (4) According to the landscape characteristics of cultivated land, the degree of spatial division and agglomeration of cultivated land patches have a significant impact on the formation of geographical agglomeration pattern of AS, and the intensity and direction of influence show significant regional differentiation, while the patch size has no significant impact.
The knowledge of geomorphological evolution from an estuary to a river delta is necessary to form the formulation of comprehensive land-ocean interaction management strategies. In this study, the dominant factor controlling the geomorphological variability and the threshold sediment flux (TSF) to form a river delta in Hainan Island, southern China, including accommodation space, sediment supply, and reworking forces, was investigated by the method of big data analytics. The results indicated the 25 estuaries in consideration can be divided into three geographical groups, i.e. the multi-factors-controlled northern mixed estuaries, wave-dominated western estuaries with river deltas, and typhoon-dominated eastern coastal lagoon estuaries. For alluvial plain (AP) estuaries, the order of magnitude of TSFs is the smallest (101 kt·yr-1), for barrier-lagoon (BL) ones is the highest (> 102 kt·yr-1), and for drowned valley (DV) ones is moderate (102kt·yr-1). The river deltas associated with DV systems should be relatively large, and those related to BLs should be small, with the AP deltas being between the above mentioned types. The present study provides a technique to evaluate the role played by TSF for the formation of river deltas in micro-tidal and wave-dominated and typhoon-influenced coastal environments.
This paper reports the phenological response of forest vegetation to climate change (changes in temperature and precipitation) based on Moderate Resolution Imaging Spectroradiometer (MODIS) Enhanced Vegetation Index (EVI) time-series images from 2000 to 2015. The phenological parameters of forest vegetation in the Funiu Mountains during this period were determined from the temperature and precipitation data using the Savitzky-Golay filter method, dynamic threshold method, Mann-Kendall trend test, the Theil-Sen estimator, ANUSPLIN interpolation and correlation analyses. The results are summarized as follows: (1) The start of the growing season (SOS) of the forest vegetation mainly concentrated in day of year (DOY) 105-120, the end of the growing season (EOS) concentrated in DOY 285-315, and the growing season length (GSL) ranged between 165 and 195 days. There is an evident correlation between forest phenology and altitude. With increasing altitude, the SOS, EOS and GSL presented a significant delayed, advanced and shortening trend, respectively. (2) Both SOS and EOS of the forest vegetation displayed the delayed trend, the delayed pixels accounted for 76.57% and 83.81% of the total, respectively. The GSL of the forest vegetation was lengthened, and the lengthened pixels accounted for 61.21% of the total. The change in GSL was mainly caused by the decrease in spring temperature in the region. (3) The SOS of the forest vegetation was significantly partially correlated with the monthly average temperature in March, with most correlations being negative; that is, the delay in SOS was mainly attributed to the temperature decrease in March. The EOS was significantly partially correlated with precipitation in September, with most correlations being positive; that is, the EOS was clearly delayed with increasing precipitation in September. The GSL of the forest vegetation was influenced by both temperature and precipitation throughout the growing season. For most regions, GSL was most closely related to the monthly average temperature and precipitation in August.
Lake ice phenology is considered a sensitive indicator of regional climate change. We utilized time series information of this kind extracted from a series of multi-source remote sensing (RS) datasets including the MOD09GQ surface reflectance product, Landsat TM/ETM+ images, and meteorological records to analyze spatiotemporal variations of ice phenology of Qinghai Lake between 2000 and 2016 applying both RS and GIS technology. We also identified the climatic factors that have influenced lake ice phenology over time and draw a number of conclusions. First, data show that freeze-up start (FUS), freeze-up end (FUE), break-up start (BUS), and break-up end (BUE) on Qinghai Lake usually occurred in mid-December, early January, mid-to-late March, and early April, respectively. The average freezing duration (FD, between FUE and BUE), complete freezing duration (CFD, between FUE and BUS), ice coverage duration (ICD, between FUS and BUE), and ablation duration (AD, between BUS and BUE) were 88 days, 77 days, 108 days and 10 days, respectively. Second, while the results of this analysis reveal considerable differences in ice phenology on Qinghai Lake between 2000 and 2016, there has been relatively little variation in FUS times. Data show that FUE dates had also tended to fluctuate over time, initially advancing and then being delayed, while the opposite was the case for BUS dates as these advanced between 2012 and 2016. Overall, there was a shortening trend of Qinghai Lake’s FD in two periods, 2000-2005 and 2010-2016, which was shorter than those seen on other lakes within the hinterland of the Tibetan Plateau. Third, Qinghai Lake can be characterized by similar spatial patterns in both freeze-up (FU) and break-up (BU) processes, as parts of the surface which freeze earlier also start to melt first, distinctly different from some other lakes on the Tibetan Plateau. A further feature of Qinghai Lake ice phenology is that FU duration (between 18 days and 31 days) is about 10 days longer than BU duration (between 7 days and 20 days). Fourth, data show that negative temperature accumulated during the winter half year (between October and the following April) also plays a dominant role in ice phenology variations of Qinghai Lake. Precipitation and wind speed both also exert direct influences on the formation and melting of lake ice cover and also cannot be neglected.
Mountain glaciers, which perform a unique and irreplaceable ecological service, provide the material basis and characteristic cultural foundation of the ecological environment and sustainable socio-economic development in arid areas. However, few studies have estimated the service value of glaciers in regulating ecological environment and providing human welfare. According to the statistics of the First and Second Chinese Glacier Inventory (FCGI/SCGI), this study analyzed the variations in glacier area and ice volume in the Tianshan Mountains in China and modeled the ecosystem service function of mountain glaciers. The service value per unit area and equivalent factor methods were combined to determine the annual value of the ecological service provided by glaciers in the study area. The results show that: (1) In the period 1970-2010, the glacier area decreased by 1274 km2 (the ratio of area shrinkage was 13.9%) and the annual average decrease in ice volume was 4.08×10⁹ m3. The increase in glacier area at high altitudes (> 5200 m) may be due to the fact that glacier accumulation caused by increasing precipitation is greater than glacier melting caused by rising temperatures. (2) The annual value of the ecological service provided by glaciers in the study area is 60.2 billion yuan. The values of climate regulation, hydrological regulation, and freshwater resource supply account for 66.4%, 21.6%, and 9.3% of the total value respectively. The annual value of the ecological service provided by hydroelectric power is 350 million yuan. (3) From a comparative analysis of the glaciers, forest, grassland and wetland ecosystems, the supply of freshwater resources/physical production and ecological regulation represent the main contributions of the four types of system, and the ecosystem service value of glaciers per unit area is higher than that of other types of ecosystem. This research will improve the understanding of the impact of glaciers on human welfare and maintenance of the ecological environment and will promote the ecological security of the cryosphere, environmental protection, and the sustainable use of resources.
Glaciers and snow are major constituents of solid water bodies in mountains; they can regulate the stability of local water sources. However, they are strongly affected by climate change. This study focused on the Tianshan Mountains, using glacier and snow datasets to analyse variations in glaciers, snow, water storage, and runoff. Three typical river basins (Aksu, Kaidou, and Urumqi Rivers) were selected to interpret the impacts of glacier and snow changes on regional water resources in the Tianshan Mountains. The results exhibited a nonlinear functional relationship between glacial retreat rate and area, demonstrating that small glacial retreat is more sensitive under climate change. Further, the glacial retreat rate at the low-middle elevation zone was seen to be faster than that at the high elevation zone. The regional average terrestrial water storage (TWS) decrease rate in the Tianshan Mountains was -0.7±1.53 cm/a during 2003-2015. The highest TWS deficit region was located in the central part of the Tianshan Mountains, which was closely related to sharp glacial retreats. The increases in glacier and snow meltwater led to an increase in runoff in the three typical river basins, especially that of the Aksu River (0.4×10⁸ m3/a). The decreasing and thinning of areas, and increasing equilibrium line altitude (ELV) of glaciers have been the major causes for the decrease in runoff in the three river basins since the mid-1990s. Therefore, the results reveal the mechanisms causing the impacts of glaciers and snow reduction in mountains on regional water resources under climate change, and provide a reference for water resources management in the mountainous river basins.
Understanding the past variations in extreme drought is especially beneficial to the improvementof drought resistance planning and drought risk management in China. Based on the monitoring data of meteorological stations from 1961 to 2015 and a meteorological drought index, the Standardized Precipitation Evapotranspiration Index (SPEI), the spatio-temporal variations in extreme drought at inter-decadal, inter-annual and seasonal scales in China were analyzed. The results revealed that 12 months cumulative precipitation with 1/2 to 5/8 of average annual precipitation will trigger extreme drought. From the period 1961-1987 to the period 1988-2015, the mean annual frequency of extreme drought (FED) increased along a strip extending from southwest China (SWC) to the western part of northeast China (NEC). The increased FED showed the highest value in spring, followed by winter, autumn and summer. There was a continuous increase in the decadal-FED from the 1990s to the 2010s on the Tibetan Plateau (TP), the southeast China (SEC) and the SW. During the period 1961-2015, the number of continuous drought stations was almost the same among 4 to 6 months and among 10 to 12 months of continuous drought, respectively. It can be inferred that drought lasting 6 or 12 months may lead to more severe drought disasters due to longer duration. The range of the longest continuous drought occurred in the 21st century had widely increased compared with that in the 1980s and the 1990s. Our findings may be helpful for water resources management and reducing the risk of drought disasters in China.
Soil stores a large amount of the terrestrial ecosystem carbon (C) and plays an important role in maintaining global C balance. However, very few studies have addressed the regional patterns of soil organic carbon (SOC) storage and the main factors influencing its changes in Chinese terrestrial ecosystems, especially using field measured data. In this study, we collected information on SOC storage in main types of ecosystems (including forest, grassland, cropland, and wetland) across 18 regions in China during the 1980s (from the Second National Soil Survey of China, SNSSC) and the 2010s (from studies published between 2004 and 2014), and evaluated its changing trends during these 30 years. The SOC storage (0-100 cm) in Chinese terrestrial ecosystems was 83.46 ± 11.89 Pg C in the 1980s and 86.50 ± 8.71 Pg C in the 2010s, and the net increase over the 30 years was 3.04 ± 1.65 Pg C, with an overall rate of 0.101 ± 0.055 Pg C yr-1. This increase was mainly observed in the topsoil (0-20 cm). Forests, grasslands, and croplands SOC storage increased 2.52 ± 0.77, 0.40 ± 0.78, and 0.07 ± 0.31 Pg C, respectively, which can be attributed to the several ecological restoration projects and agricultural practices implemented. On the other hand, SOC storage in wetlands declined 0.76 ± 0.29 Pg C, most likely because of the decrease of wetland area and SOC density. Combining these results with those of vegetation C sink (0.100 Pg C yr-1), the net C sink in Chinese terrestrial ecosystems was about 0.201 ± 0.061 Pg C yr-1, which can offset 14.85%-27.79% of the fossil fuel C emissions from the 1980s to the 2010s. These first estimates of soil C sink based on field measured data supported the premise that China’s terrestrial ecosystems have a large C sequestration potential, and further emphasized the importance of forest protection and reforestation to increase SOC storage capacity.
Changes in regional moisture patterns under the impact of climate change are an important focus for science. Based on the five global climate models (GCMs) participating in the Coupled Model Intercomparison Project Phase 5 (CMIP5), this paper projects trends in the area of arid/humid climate regions of China over the next 100 years. It also identifies the regions of arid/humid patterns change and analyzes their temperature sensitivity of responses. Results show that future change will be characterized by a significant contraction in the humid region and an expansion of arid/humid transition zones. In particular, the sub-humid region will expand by 28.69% in the long term (2070-2099) relative to the baseline period (1981-2010). Under 2°C and 4°C warming, the area of the arid/humid transition zones is projected to increase from 10.17% to 13.72% of the total of China. The humid region south of the Huaihe River Basin, which is affected mainly by a future increase in evapotranspiration, will retreat southward and change to a sub-humid region. In general, the sensitivity of responses of arid/humid patterns to climate change in China will intensify with accelerating global warming.
Under the impacts of climate change and human activities, great uncertainties still exist in the response of climate extremes, especially in Central Asia (CA). In this study, we investigated spatial-temporal variation trends and abrupt changes in 17 indices of climate extremes, based on daily climate observations from 55 meteorological stations in CA during 1957-2005. We also speculated as to which atmospheric circulation factors had the greatest impacts on climate extremes. Our results indicated that the annual mean temperature (Tav), mean maximum and minimum temperature significantly increased at a rate of 0.32oC/10a, 0.24oC/10a and 0.41oC/10a, respectively, which was far higher than the increasing rates either globally or across the Northern Hemisphere. Other temperature extremes showed widespread significant warming trends, especially for those indices derived from daily minimum temperature. All temperature extremes exhibited spatially widespread rising trends. Compared to temperature changes, precipitation extremes showed higher spatial and temporal variabilities. The annual total precipitation significantly increased at a rate of 4.76 mm/10a, and all precipitation extremes showed rising trends except for annual maximum consecutive dry days (CDD), which significantly decreased at a rate of -3.17 days/10a. On the whole, precipitation extremes experienced slight wetter trends in the Tianshan Mountains, Kazakhskiy Melkosopochnik (Hill), the Kyzylkum Desert and most of Xinjiang. The results of Cumulative Deviation showed that Tav and Txav had a significant abrupt change around 1987, and all precipitation indices experienced abrupt changes in 1986. Spearman’s correlation analysis pointed to Siberian High and Tibetan Plateau Index_B as possibly being the most important atmospheric circulation factors affecting climate extremes in CA. A full quantitative understanding of these changes is crucial for the management and mitigation of natural hazards in this region.